 Traffic operators looking to measure performance of roadways, agencies or even individual teams now have a new tool with Real-Time Statistics (RTS) available in TIC3 from GEWI.
Real-time statistics can be used to analyze any data stored on TIC and to provide a visual overview of the results.
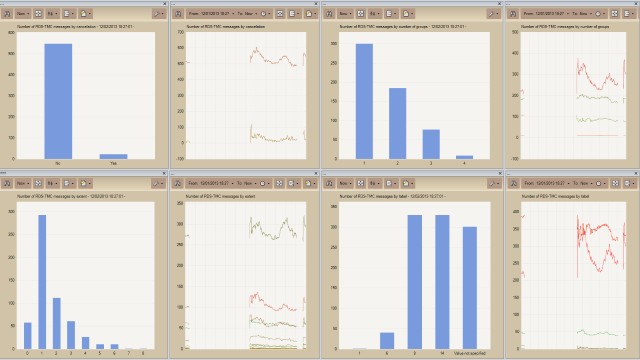
Simple line graphs and bar-charts can be created in real-time such as in the dashboard view above which can be used to compare current and historical performance.
As an example, some pre-defined performance measures for traffic and travel event data include:
- Length of stopped traffic
- Number of operator tasks
- Number of events by road class
- Number of events by event category
- Number of events by urgency
- Number of events from other sources
- …and many more
The statistics can also be scheduled to be exported at specific times such as at the end of each day or week and these can be automatically distributed by email.
If more detailed analysis or a different presentation format is required, the same statistical data can be exported in XML or CSV format and then imported into third-party analytical tools or spread sheet applications.
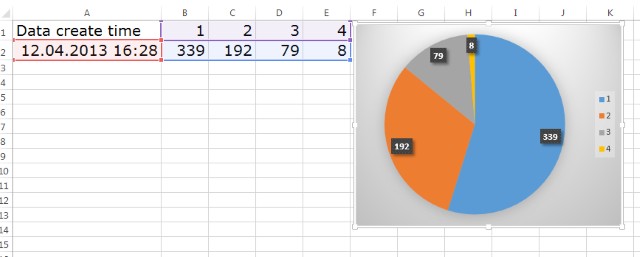 As a simple example using the same date exported in one of the dashboard windows above, the same data is shown in an Excel spreadsheet with a resulting pie chart.
Excel chart TIC Real-Time Statistics can significantly improve operators’ and managers’ ability to achieve a better understanding of trends, patterns and conditions and corresponding workloads on operators. Analysis of these statistics can allow for a better deployment of resources to manage the road network and human resources.
For more information about TIC Real-Time Statistics, contact nils.richter@gewi.com.